Well, I finally generated some weak classifiers that yield distinct curves with fairly good separation.
Calculating the Error Rate
Using the filters that I had previously generated, I calculated the error rate experimentally. To do this, I removed the first 10 positive examples from the positive training set. In other words, I removed 10 images of the letter 'e' from the pool of images that I used to generate the filter response curves. These 10 images made up my testing set. For each filter, I then calculated its response to all of the positive training images ( excluding the 10 images that I had removed for a testing set ) and its response to all of the negative training images. In order to fit gaussian approximations to these responses, I calculated the mean and standard deviations of each group of responses --calculating for the positive and negative responses separately.
To calculate the actual error rate, I performed the following algorithm:
for each filter:
begin
0) initialize an integer value to 0 for the current filter. This value will accumulate "votes"
based on the classification of the test images.
for each image in the testing set: ( ie: the set of 10 positive images set aside )
begin
1) convolve the current filter with the current image to yield a response --call it x
2) using the calculated means and standard deviations for this filter, (call them pm, ps,nm, ns for positive mean, positive standard deviation, negative mean, and negative standard deviation) retrieve likelyhood estimates for x. Call them P(x | p) and P(x | n) for positive and negative likelyhoods, respectively. Since the estimated gaussians represent PDFs (Probability Density Functions), P(x | p) and P(x | n) are calculated as follows:
P(x | p) =(1/(sqrt(2*pi)*ps)) * exp(-((x-pm).^2)/(2*ps^2));
P(x | p) =(1/(sqrt(2*pi)*ns)) * exp(-((x-nm).^2)/(2*ns^2));
3) plug each likelyhood into Bayes' equation to get the probability of being an 'e' and not being an 'e'. Call them P(p | x) and P(n | x), respectively. Let P(p) and P(n) be the prior probabilities for 'e' and not 'e', respectively. Remember that P(p) and P(n) represent the probability of a random letter on a sheet of paper being an 'e' and not being an 'e'.
P(p | x) = P(x | p) * P(p)
P(n | x) = P(x | n) * P(n)
Note that in Bayes' equation, these terms are usually divided by the probability of a feature vector occuring. Since there are only two different possibilities for classification, 'e' or not 'e', the probability of a feature vector occuring is ignored since these probabilities will just be compared to each other, as you will see below.
4) classify the current test image by comparing the probabilities computed in step 3:
if P(p | x) > P(n | x), then the image is classified as 'e', so output 1
if P(n | x) > P(p | x), then the image is classified as not 'e', so output = 0
This essentially means that if an image has a greater probability of being an 'e' than not being an 'e', then it should be classified as an 'e' (and vice-versa). This reminds me graphically of an individual step in K-Means in that at any individual step in computing a boundary for K-Means, K-Means simply classifies an input value as being whichever mean that value is closest to in euclidean distance.In contrast, the type of Bayes' classifier that I have implemented classifies an input value as one class or another based on how many standard deviations away from the mean of each curve it is.
5) for the current filter, add the following to the running total of votes for the current filter:
1 - if the input image is an 'e' and it was classified as such
0 - if the input image is an 'e' but it was classified as not an 'e'
Since the test images are known to be positive (ie: known to be 'e' ), the result of the classifier can simply be added to the current vote tally for the current filter.
end
end
After these steps were run, each filter was left with a number of votes correponding to the number of 'e's classified correctly. If a filter has a vote tally of 10, for instance, this means the classifier built from this filter classified all 10 of the test images correctly as 'e'. Since the testing images are known to be 'e's ahead of time, they are referred to as labelled.
Results
Best Filter
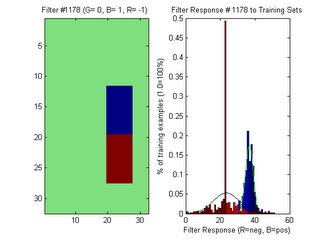
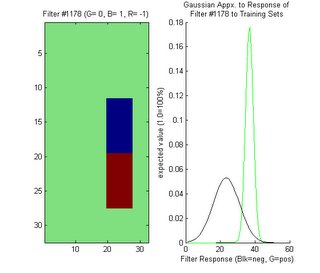
I ran the aformentioned algorithm for all filters and for 10 positive test images. I then arranged the filter numbers according to how many votes each one had. Here is an example of one of the best filters, showing histograms of its training set with fitted gaussians (first below) and the same filter with just its gaussians displayed (second below)


In my most recent blog posting, I displayed a filter and its response as two nested gaussians. From the experiments I have performed since then, I realize that this graph from the previous posting was obviously incorrect. When displaying the gaussians, the prior probabilities should not be taken into account. The gaussians alone are only used to compute a likelyhood estimate --not a probability. The introduction of scaling by the prior probabilities should only be added when classifying --not visualizing the PDF. I also discovered a minor bug that was causing the mean values to be shifted incorrectly. These problems have been fixed since then.
Initially, I thought that my intuition about the location of possible features did not directly translate to the use of filters in Bayes' classifiers. Now, I can see that my intuition is confirmed by the location of this filter at almost the same location as the nested gaussian in the previous post.
Worst Filter
Here is an example of one of the worst filters, displayed in the same manner as the previous two images:


Here, the gaussians almost match up meaning that the classification of an input image is almost entirely dependent on the prior probabilities. This means that if this filter were to be used to build a classifier, then training sets might as well not have been collected at all.
Global Analysis of Filter Performance
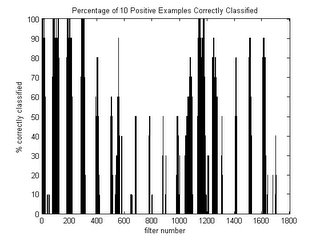
The graph below shows y percentage of filters that classified x percentage of test images correctly:

If you observe the far left-hand column, you can see that 80% of the filters are completely worthless in that they were not able to identify any letter 'e's correctly out of the 10 test images. One of the main advantages of Adaboost is that the presence of these useless filters will not affect the resulting strong classifier --Adaboost will automatically throw these filters out and choose the best ones. If you look at the far right-hand column, you will see that fewer than 5% of the filters classified all 10 of the test images correctly. It could be that the 10 test images I chose have attributes that make them easy to recognize by the top 5% of classifiers. Perhaps the top 5% classifiers would fail miserably with negative examples or most other positive examples. Adaboost will help to avoid this scenario by forcing the classifiers to focus on the most difficult examples.
The following graph represents the percentage of test images classified correctly for each filter number. For reference, an image of the filters is shown below it:


From the graph, there are many instances where a small group of filters perform exceptionally well while a different group in close proximity performs poorly. Though only 10 examples were used to test, the advantage of generating many different filters is apparent. If intuition alone is relied upon for the construction of a filter, then it could be missing an area of interest by a few pixels that might make the difference between achieving good classifications or not. Regardless of how good human intuition is, it is handy to rely upon the precision of a computer to pick up the slack.
What's Next
The next step will be to implement Adaboost using the weak classifiers I have constructed. I may need to generate more filters, but I will keep the number small for now for the sake of computation time.
Training Footage of Soda Cans
I obtained training footage from Robart III of soda cans! I will post on this once I clean up the raw footage a bit.
No comments:
Post a Comment