

 Image 1: table of keypoint matches (rows on the left matched with columns on the top)
Image 2: table of keypoints where entries with <2 or entries where an image was matched to itself were set to zero.
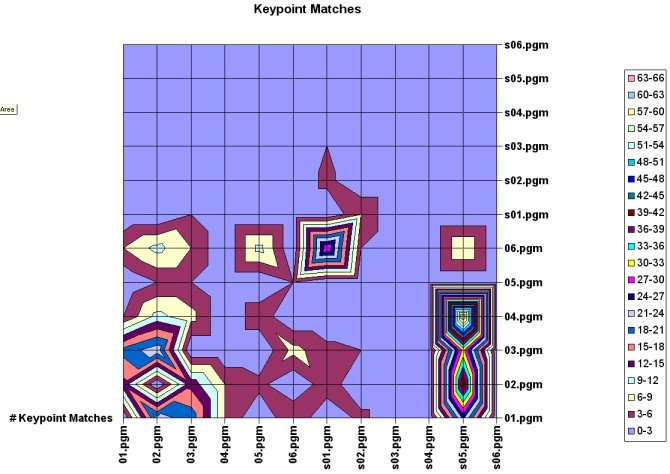
Image 3: a graph of the table in Image 2.
Today, I graphed the matching of keypoints. The x-axis of the graph above represents the keypoints from the input images. The y-axis represents the keypoints from the database. The colors indicate how many successful keypoint matches occurred. I removed all results that had fewer than 2 matching keypoints or results where the exact same keypoints were matched between identical images. One strange result is that certain images match very well when, for instance, "match image1 image2" is run and the same images yield no matches at all when "match image2 image1" is run. For instance, the image s05.pgm has 64 matches when matched with 04.pgm while no matches occur when 04.pgm is matched with s05.pgm. Because of s05.pgm's angle and small resolution of around 120x120 pixels, very few stable keypoints are found. In contrast, 04.pgm has a high resolution with around 400 keypoints found. It could be that s05.pgm's keypoints are very similar to each other because of the low pixel resolution of the image. When matched with the keypoints from 04.pgm, perhaps there are enough keypoints in 04.pgm that are close to the keypoints in s05.pgm that enough keypoints match to indicate a successful classification.
Though this table does not provide a complete set of test cases, it can be inferred that the higher resolution images match better with other high-resolution images than low to high, low to low, or high to low. I believe that the high number of matches between the high resolution images to s05.pgm is an anomoly and does not indicate that this particular image can reliably be compared to others.
If too many keypoints are stored in the database images, the computation time required to match new input images to these might be too great for real-time performance. Since Lowe was able to achieve good results using 600x480 pixel input images with smaller resolution training images, I will try doing the same. Now that I am more familiar with SIFT, I will re-read Lowe's SIFT paper. I will try to jump the gun and use the methods provided in Lowe's code to detect soda cans using footage from Robart III as the next step. This way, I will have a better idea about what problems arise. I will then look over Lowe's suggestions for narrowing down the range of useful keypoint matches using a Hough Transform etc.
1 comment:
Thank you for sharing this useful information, I will regularly follow your blog.
BA 1st Year Result
Post a Comment